|
|
||||||||||||
 |
||||||||||||
|
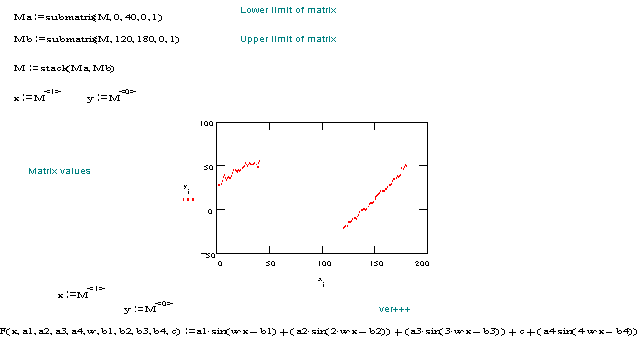
Data processing of PIROG 7 Data. For the data analysis I used Mathcad. A very powerful & easy to use program for mathematical calculations. What you see is what you get. The baseline of the PIROG 7 flight was rather awkward. Below is extracts from the data processing of one individual Scan (305), with a large gap in the curve fitting [40,120].
A fourier series is defined for the baseline F( ). The data is read from an asci file and defined as a matrix. After doing the definition
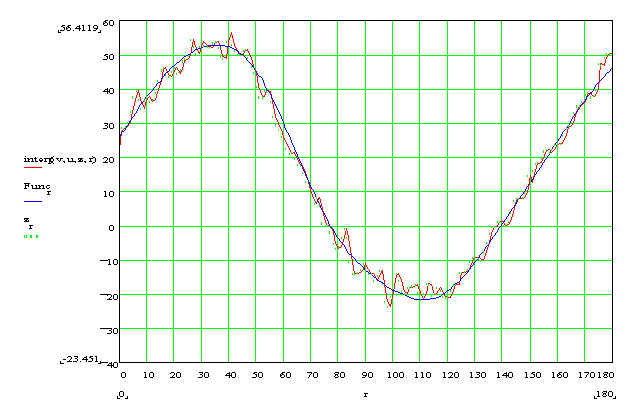
Display of baseline versus measured values.
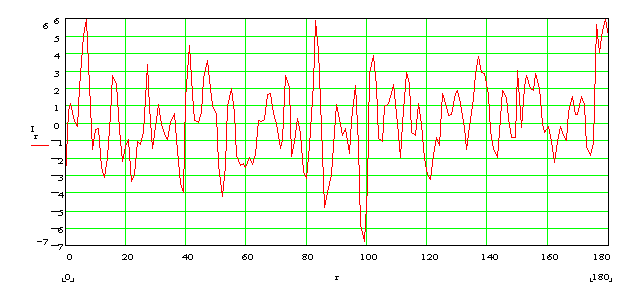
The residuals - the processed data for one individula scan.
|
| [Home] [Photos] [Space Projects] [HERSCHEL] [ODIN] [POGO] [PIROG_index] [Astronomical Instruments] [Favorites] [DownLoads] |